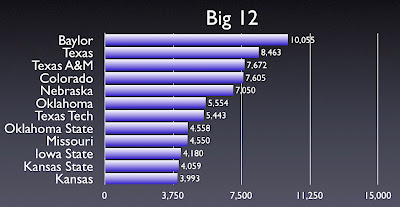
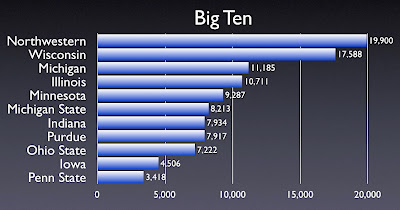
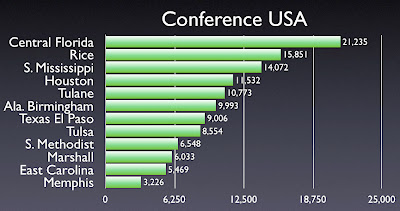
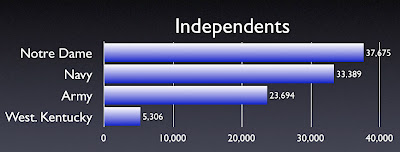
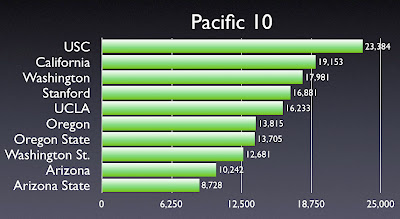
Below you will find charts listing miles traveled by conference, a list of the top and bottom 10 teams
 and conference-by-conference breakdowns, including independents. We wanted to put all of this information on one post for future reference.
As stated earlier, Richard recalibrated his data to reflect conference alignments as they were each year the games were played. It was determined that this was the proper way to treat the data, and we apologize for any errors this created.
This adjustment made for some notable changes in the top 10 list, with Hawaii falling completely out of the rankings. Under the new parameters, the Rainbows took only six nonconference trips from 1998-2007, totaling 19,834 miles. Hawaii is still the most-traveled team overall, covering 138,082 miles in the past 10 years. We hope to examine this data closely in a future post.
Click an image for a closer look.







Thanks for the info. You've put this data in a great format.
ReplyDeleteGood JOb! :)
ReplyDeleteExcellent stats and good blog.
ReplyDelete